


Regardless of how long you’ve been investing, the pace of change on Wall Street is something to marvel at. In 2021, the ageless Dow Jones Industrial Average (DJINDICES: ^DJI) , benchmark S&P 500 (SNPINDEX: ^GSPC) , and growth-focused Nasdaq Composite (NASDAQINDEX: ^IXIC) were regularly notching off new all-time closing highs. Just one year later, in 2022, all three indexes were mired in a bear market and delivering their worst full-year returns since the global financial crisis.
This year, the script has flipped, once more. Though the Dow, which outperformed the two other major stock indexes in 2022, is effectively flat on a year-to-date basis, through May 29, the S&P 500 and Nasdaq Composite have surged 9.5% and 24%, respectively.
It would seem the bulls are, once again, running wild — but looks can be deceiving.
Breadth for Wall Street’s benchmark stock index is potentially worrisome
For months, I’ve looked at a broad assortment of stock market indicators , financial metrics , and valuation tools to offer insight as to where stocks may head next. Even though there’s no such thing as a foolproof indicator, history has a way of repeating itself on Wall Street, and these indicators and metrics have the potential to give investors who follow them a leg up.
With the S&P 500 hitting a nine-month high this past week, it would appear the worst of the 2022 bear market is over. However, a closer look at the breadth within the S&P 500 reveals a different story.
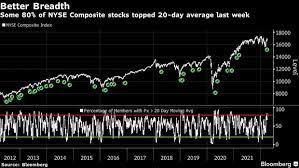
During a true bull market, we typically see a wide assortment of stocks take part in the upside. This means large-cap, mid-cap, and small-cap stocks from most sectors and industries are going to be rallying. But as you can see in the tweet below from Michael Kantro, the Chief Marketing Strategist at Piper Sandler , the S&P 500 seems to have a clear breadth problem.
Based on recent data, approximately 20% of the S&P 500’s components are beating the index on a trailing-three-month basis. The last time such a small percentage of S&P 500 stocks were outperforming the broad-based index was March 2000. Not coincidentally, the S&P 500’s closing high prior to the dot-com bubble bursting was set on March 24, 2000.
Since the S&P 500 is a market-cap-weighted index, bigger businesses are going to have more influence. The nine largest components of the S&P 500 (including companies with multiple stock classes) are:
- Apple (NASDAQ: AAPL) : 7.39% weighting
- Microsoft (NASDAQ: MSFT) : 6.97% weighting
- Amazon (NASDAQ: AMZN) : 2.95% weighting
- Nvidia (NASDAQ: NVDA) : 2.68% weighting
- Alphabet Class A shares (NASDAQ: GOOGL) : 2.11% weighting
- Alphabet Class C shares (NASDAQ: GOOG) : 1.86% weighting
- Berkshire Hathaway Class B shares (NYSE: BRK.B) : 1.65% weighting
- Meta Platforms (NASDAQ: META) : 1.62% weighting
- Tesla (NASDAQ: TSLA) : 1.43% weighting
Collectively, 28.66% of the point movements in the S&P 500 are being determined by just eight brand-name businesses. Keeping in mind that the S&P 500 is up by 9.5% year to date, here’s how the index’s largest components have fared since the start of 2023: